22. Los Armónicos.

Los Armónicos o frecuencia armónica es un ajuste ecográfico que está muy ligado a la frecuencia de la que hablábamos en el capítulo anterior y que de modo general es un parámetro técnico muy desconocido para la mayoría de los operadores que se sientan frente a un ecógrafo a realizar una eco.

Es un ajuste o parámetro de difícil comprensión en lo que a su formación se refiere, pero es muy útil y vamos a intentar desmenuzar bien su base teórica para que nos ayude a usarlos mejor…

Es un sistema de recepción de ecos para captar señales con una frecuencia el doble o más que la emitida, que solo es posible producirla por la reverberación de los tejidos y nunca por un artefacto. Es decir, yo emito un pulso de ultrasonidos a 5 MHz y recojo ecos de retorno de 10 MHz discriminando los que están por debajo de ese umbral. Uno de los efectos perseguidos con este ajuste es «limpiar» la imagen de aquellos ecos de retorno que no son útiles y «ensucian» la imagen con ese moteado característico de la imagen fundamental de la ecografía.

En resumen, puedo emitir una frecuencia f y recibir aquellos ecos de retorno que sean 2f, 3f o más…

¿Imagen fundamental?, te explico, la imagen fundamental es una imagen primaria, sin armónicos, con sus cosas buenas y sus cosas malas desde el punto de vista diagnóstico, es la imagen de base que nos ofrece el ecógrafo. Esta imagen es susceptible de ser modificada con todos los ajustes que hemos ido explicando hasta ahora y luego, aplicar los armónicos para ver si nos ofrece ese salto de calidad, que se produce casi siempre cuando ponemos los armónicos.

Harmonics or harmonic frequency is an ultrasound adjustment that is closely linked to the frequency that we talked about in the previous chapter and that in general is a technical parameter that is very unknown to most operators who sit in front of an ultrasound machine to perform an echo It is an adjustment or parameter that is difficult to understand in terms of its training, but it is very useful and we are going to try to break down its theoretical base to help us use them better … It is a system of reception of echoes to pick up signals with a frequency twice or more than that emitted, which can only be produced by the reverberation of the tissues and never by an artifact. That is to say, I issue a pulse of ultrasound at 5 MHz and I collect echoes of 10 MHz return discriminating those that are below that threshold. One of the effects pursued with this adjustment is to «clean» the image of those return echoes that are not useful and «dirty» the image with that mottled characteristic of the fundamental image of the ultrasound. In summary, I can issue a frequency f and receive those return echoes that are 2f, 3f or more … Fundamental image ?, I explain, the fundamental image is a primary image, without harmonics, with its good things and its bad things from the diagnostic point of view, is the basic image that the ultrasound machine offers us. This image is susceptible to be modified with all the adjustments that we have been explaining so far and then apply the harmonics to see if it offers that quality jump, which occurs almost always when we put the harmonics.
Imagen de alta frecuencia con y sin armónicos.

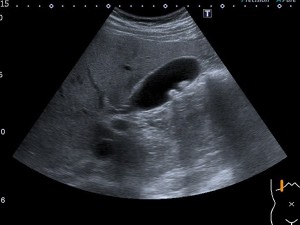
Las diferencias en algunos estudios son extremadamente llamativas, pudiendo llegar a diferenciar estructuras usando este ajuste que con la imagen fundamental se observan dificultosamente. En la imagen anterior, Tendón extensor común de los dedos de la mano. Misma imagen sin y con armónicos. Juzgar vosotros.

The differences in some studies are extremely striking, being able to differentiate structures using this adjustment that with the fundamental image are observed difficultly. In the previous image, Tendon extensor common of the fingers of the hand. Same image without and with harmonics. Judge you.
Observa las diferencias entre las dos imágenes.

En la imagen vemos dos imágenes, observamos que la nitidez y la definición de las estructuras es mucho mayor con armónicos que sin ellos.

Los armónicos es un ajuste implementado gracias al avance y la investigación de las casas comerciales en pos de conseguir una imagen mejor. Ya suelen estar integrados en los presets que vienen de fábrica o en la configuración personal que nos ofrece el técnico de aplicaciones cuando nos instala el equipo, una labor vital, por cierto.

Podemos explicar que los armónicos son, ecos de retorno múltiplos de la frecuencia transmitida en origen y que se debe a una propagación de la onda de ultrasonidos donde el componente de alta presión o compresión se transmite más rápidamente que el componente negativo o rarefacción.

Como esta explicación resulta bastante dura, pero no hay otra, puesto que es física pura, vamos a centrarnos en lo que importa en la práctica y que son sus ventajas, las mismas que a continuación te presento esquemáticamente.

In the image we see two images, we observe that the clarity and definition of the structures is much greater with harmonics than without them. The harmonics is an adjustment implemented thanks to the advance and research of the commercial houses in pursuit of achieving a better image. They are usually integrated in the presets that come from the factory or in the personal configuration that the application technician offers us when he installs the equipment, a vital task, by the way. We can explain that harmonics are return echoes multiples of the frequency transmitted at origin and that is due to a propagation of the ultrasound wave where the component of high pressure or compression is transmitted faster than the negative component or rarefaction. As this explanation is quite hard, but there is no other, since it is pure physics, we are going to focus on what matters in practice and what are its advantages, the same ones that I present here schematically.
  • Reducen los artefactos y aumentan la resolución.
  • Los armónicos o frecuencia armónica mejora la imagen respecto de la frecuencia fundamental, ya que esta debida a las interfases puede resultar poco resolutiva
  • Utilizaremos armónicos cuando la imagen fundamental no sea suficientemente buena.
  • Es una imagen más nítida ya que “limpia” la imagen fundamental.
  • En frecuencias altas ofrece una gran calidad de imagen.
  • Con los armónicos reducimos el moteado.
  • They reduce the artifacts and increase the resolution.
  • The harmonics or harmonic frequency improves the image with respect to the fundamental frequency, since this due to the interfaces can be not very resolutive
  • We will use harmonics when the fundamental image is not good enough.
  • It is a sharper image because it «cleans» the fundamental image.
  • In highs frequencies it offers a great image quality.
  • With the harmonics we reduce the mottling.

El moteado es un factor de degradación de la imagen producido por la dispersión de ultrasonidos de pequeños reflectores o pequeñas interfases, mostrando una imagen con un grano característico. En estas pequeñas interfases se producen ecos de retorno que ensucian la imagen y no aportan información porque una parte de los ecos de retorno producidos en las interfases ni siquiera llega al transductor, los eliminamos y nos queda una imagen mejor.

No confundamos, para ir terminando, armónicos con filtros porque no es lo mismo, el armónico es una representación selectiva de los mejores ecos de retorno. Dependiendo del equipo, normalmente de su gama, podemos disfrutar de varios tipos de armónicos.

En la pantalla la imagen armónica se identifica habitualmente dependiendo de la casa comercial acompañando al valor de la frecuencia alguna letra o palabra, en la imagen fundamental, la frecuencia aparecerá como un valor numérico solitario (últimas imágenes).

Los armónicos deben estar siempre a disposición del operador, y se identifican en muchas marcas como THI o tissue harmonic imaging. El uso de los armónicos no es obligatorio, pero recomendable. Siempre asociando su uso a las características del paciente y del estudio.

Mottle is a factor of degradation of the image produced by the scattering of ultrasound of small reflectors or small interfaces, showing an image with a characteristic grain. In these small interfaces return echoes are produced that dirty the image and do not provide information because a part of the return echoes produced at the interfaces does not even reach the transducer, we eliminate them and we have a better image. Let’s not confuse, to finish, harmonics with filters because it is not the same, the harmonic is a selective representation of the best return echoes. Depending on the equipment, normally of its range, we can enjoy several types of harmonics. In the screen the harmonic image is usually identified depending on the commercial house accompanying the value of the frequency some letter or word, in the fundamental image, the frequency will appear as a solitary numerical value (last images). Harmonics must always be available to the operator, and are identified in many brands as THI or tissue harmonic imaging. The use of harmonics is not mandatory, but recommended. Always associating its use with the characteristics of the patient and the study.
Observar en recuadro rojo el tipo de armónico y su valor numérico con las letras.
Imagen fundamental y valor de frecuencia en solitario.


21. La Frecuencia.

La Frecuencia es sin duda el ajuste ecográfico más importante desde el punto de vista técnico a la hora de hacer una ecografía, es el eslabón más importante de la cadena que forman los «5 fantásticos» que son en mi opinión, la Ganancia General, la Ganancia Parcial, el Foco, la Profundidad y la mencionada Frecuencia. Manejando estos 5 parámetros podemos estar seguros de que si los usamos correctamente, nuestra imagen será diagnóstica, claro está, si sabemos como realizar los cortes de la estructura anatómica a estudio.

Este ajuste lo enlazamos https://ecografiafacil.com/2017/12/14/4-magnitudes-de-la-onda-ultrasonica-la-frecuencia/ con este episodio donde hablábamos de modo más abstracto de esta magnitud, pero que son la misma cosa. En ese episodio decía que según las frecuencia utilizadas en los ecógrafos que usamos para realizar los estudios, utilizaremos diferentes transductores o sondas ecográficas para llevar a cabo dichos estudios, me explico…

Si utilizamos frecuencias bajas (entre 2 y 6 MHz), tenemos que usar una sonda cónvex, y estudiaremos estructuras con profundidades grandes, Abdómenes y Ginecológicas.

Si usamos frecuencias altas (entre 10 y 18 MHz), utilizamos sonda lineal y serán objeto de estudio estructuras superficiales como, Músculos, Tendones, Ligamentos, Partes Blandas, Tiroides y Cuello, estructuras vasculares superficiales, Testes, Mama, Ojos, etc…Muy versátiles, por tanto, estas frecuencias altas. Incluso, podemos usar éstas en ecografía pediátrica, si la/el paciente es suficientemente pequeño, por ejemplo, es muy normal realizar ecografía de Caderas, Transfontanelar y Abdomen a bebés, y estas frecuencias altas son ideales.

¿Pero qué logramos en realidad usando una u otra frecuencia? Debemos partir de la base que siempre debemos usar la mayor frecuencia posible para obtener la imagen con máxima resolución posible.

Para realizar el estudio de un músculo, por ejemplo, usaremos, dentro de las frecuencias altas, la más alta si el músculo es muy superficial, pero si el músculo es más profundo y/o el paciente es muy voluminoso quizá sea bueno bajar un salto de frecuencia, así ganaremos un poco más de visión profunda aunque perdamos un poco de resolución o nitidez.

This adjustment is linked to https://ecografiafacil.com/2017/12/14/4-magnitudes-of-the-onda-ultrasonica-la-frecuencia/ with this episode where we talked in a more abstract way of this magnitude, but which are the same thing. In that episode he said that according to the frequency used in the ultrasound machines that we use to carry out the studies, we will use different transducers or sonographic probes to carry out these studies, I mean … If we use low frequencies (between 2 and 6 MHz), we have to use a convex probe, and we will study structures with large depths, abdomens and gynecology. If we use high frequencies (between 10 and 18 MHz), we use linear probe and will study superficial structures such as muscles, tendons, ligaments, soft parts, thyroid and neck, superficial vascular structures, testes, breast, eyes, etc. . Very versatile, therefore, these high frequencies. We can even use these in pediatric ultrasound, if the patient is small enough, for example, it is very normal to perform ultrasound of hips, transfontanel and abdomen to babies, and these high frequencies are ideal. But what do we actually achieve by using one or the other frequency? We must start from the base that we should always use as often as possible to obtain the image with maximum possible resolution. To perform the study of a muscle, for example, we will use, within the high frequencies, the highest if the muscle is very superficial, but if the muscle is deeper and / or the patient is very voluminous, it may be good to jump down of frequency, this way we will gain a little more of deep vision although we lose a little resolution or clarity.
Diferencias de nitidez. Frecuencias altas.

En la imagen superior observamos dos imágenes idénticas del Tendón extensor común de los dedos de la mano (flecha amarilla) estudiado con sonda de alta frecuencia y donde en la imagen superior se observa en recuadro rojo que se emplean 12 MHz y en la inferior, la misma estructura (flecha verde) estudiada con 7 MHz. Nótese la abrumadora diferencia de nitidez de la imagen superior.

Dentro de las frecuencias altas y bajas podemos elegir entre varias, eso es debido al Ancho de Banda…Es decir, para frecuencias bajas, por ejemplo para hacer un abdomen, usaré frecuencia de 3 mHz si en paciente es obeso (mucha profundidad) y 5 mHz si el paciente es muy delgado (poca profundidad), o de otra manera, mi sonda cónvex (baja frecuencia) puede usar varias frecuencias bajas en función de las necesidades del estudio. De otro modo, el ancho de banda es una horquilla de frecuencias que puedo usar dentro de un tipo de frecuencias, bien sean altas o bajas. Un ejemplo de esto lo tenemos en las imágenes siguientes.

In the upper image we observed two identical images of the common extensor tendon of the fingers of the hand (yellow arrow) studied with high frequency probe and where in the upper image it is observed in red box that 12 MHz are used and in the lower one, the same structure (green arrow) studied with 7 MHz. Note the overwhelming difference in sharpness of the upper image.
Within the high and low frequencies we can choose among several, that is due to the Bandwidth … That is, for low frequencies, for example to make an abdomen, I will use a frequency of 3 mHz if the patient is obese (a lot of depth) and 5 mHz if the patient is very thin (shallow), or otherwise, my convex probe (low frequency) can use several low frequencies depending on the needs of the study. Otherwise, the bandwidth is a fork of frequencies that I can use within a type of frequencies, either high or low. We have an example of this in the following images.
3 MHz.
5 MHz.

Otro ejemplo…para hacer un hombro, usaré frecuencia alta de 12 mHz si en paciente es muy musculoso (mucha profundidad) y 18 mHz si el paciente es muy delgado (poca profundidad), o de otra manera, mi sonda lineal (alta frecuencia) puede usar varias frecuencias altas en función de las necesidades del estudio.

Por ejemplo en algunas patologías es muy útil el cambio de frecuencias, por ejemplo en los hígados con Esteatosis Hepática donde no se observa bien los planos más profundos del órgano afectado. En la imagen siguiente podemos ver como disminuyendo la frecuencia ganamos poder de penetración pudiéndose observar en la profundidad con más claridad la interfase producida por el diafragma (línea blanca hiperecogénica o brillante).

Another example … to make a shoulder, I will use a high frequency of 12 mHz if the patient is very muscular (very deep) and 18 mHz if the patient is very thin (shallow), or otherwise, my linear probe (high frequency) can use several high frequencies depending on the needs of the study. For example, in some diseases it is very useful to change frequencies, for example in livers with Hepatic steatosis where the deeper planes of the affected organ are not well observed. In the following image we can see how decreasing the frequency we gain penetration power being able to observe in the depth with more clarity the interface produced by the diaphragm (hyperechogenic or bright white line).

En el equipo la presentación de este ajuste puede estar en la botonera o en la pantalla táctil, en casi todos los equipos ya se incorpora en esta última apariencia. Además esa frecuencia puede aparecer con un valor numérico o con grados de poder de penetración, como en las imágenes de a continuación.

In the equipment the presentation of this adjustment can be in the keypad or on the touch screen, in almost all the equipment is already incorporated in this last appearance. In addition, this frequency can appear with a numerical value or with degrees of penetration power, as in the images below.
Frecuencia con valor numérico.
Frecuencia con valor según poder de penetración.

En función del grado de penetración, tendremos «Penetración» para las frecuencias bajas dentro del ancho de banda correspondiente a esa sonda y «Resolución», para frecuencias altas dentro de esa misma sonda, el punto intermedio se queda para «General».

Si el valor fuese numérico, lo veremos reflejado en la pantalla, como en la imagen siguiente…

Depending on the degree of penetration, we will have «Penetration» for the low frequencies within the bandwidth corresponding to that probe and «Resolution», for high frequencies within that same probe, the intermediate point stays for «General». If the value were numeric, we will see it reflected on the screen, as in the following image …
En rojo, rodeado el valor de la frecuencia usada.

Es un parámetro dependiente del operador, del Técnico en nuestro caso, su buen uso relanza la calidad del estudio.

Por tanto y para terminar este denso pero importantísimo capítulo, resumimos con dos frases que deben ser grabadas para cualquiera que se precie de sentarse delante de un ecógrafo…y son…

Si aumentamos la frecuencia tendremos menor poder de penetración pero mayor resolución.

Si disminuimos la frecuencia tendremos mayor poder de penetración pero menor resolución.

Además, la elección de la frecuencia correcta la marca las características físicas de cada paciente, cuando mas grueso sea, menos frecuencia debemos emplear.

It is a parameter dependent on the operator, the Technician in our case, its good use re-launches the quality of the study. Therefore and to finish this dense but very important chapter, we summarize with two phrases that should be recorded for anyone who claims to sit in front of an ultrasound … and they are … If we increase the frequency we will have less penetration power but higher resolution. If we decrease the frequency we will have greater penetration power but lower resolution. In addition, choosing the correct frequency marks the physical characteristics of each patient, the thicker it is, the less frequently we should use it.

18. La Profundidad.

La profundidad es un ajuste ecográfico en el cual vamos a poder controlar la distancia a la que queremos trabajar o la distancia que necesitamos en centímetros para estudiar aquella estructura que deseemos. Por ejemplo, usaremos profundidades muy diferentes para estudiar un tendón supraespinoso o de un hígado.

Para estudios superficiales como pueden ser ecografías musculares o de partes blandas emplearemos profundidades pequeñas de máximo 4 cms para un paciente estándar, pero para estudiar el Abdomen de un adulto necesitamos perentoriamente utilizar profundidades de unos 15 cms…

The depth is an ultrasound adjustment in which we will be able to control the distance we want to work or the distance we need in centimeters to study that structure we want. For example, we will use very different depths to study a supraspinatus or a liver tendon. For superficial studies such as muscle or soft tissue ultrasounds we will use small depths of maximum 4 cm for a standard patient, but to study the abdomen of an adult we need to use depths of approximately 15 cm.
Imágenes de Hígado y Tendón del Supraespinoso y sus profundidades de estudio en rectángulo amarillo.

Bien, esto es fácil de entender, pero este tipo de distancias se acompañan de la elección de sondas ecográficas que nos den la imagen correcta para cada estudio…cuando hablamos de los tipos de transductores, dijimos que los lineales eran de alta frecuencia y los cónvex de baja frecuencia. En el siguiente enlace puedes consultar esta información. https://ecografiafacil.com/2018/01/01/11-tipos-de-transductores/

Por tanto, para técnicas que requieran estudios de poca profundidad usaremos sondas de alta frecuencia y para estudios de más profundidad, usaremos sondas de baja frecuencia.

Este ajuste suele estar situado en la botonera a la derecha del trackball y el freezer, se puede identificar en ingles como «Depth» y suele situarse junto al foco, otro ajuste de gran importancia y que estudiaremos muy próximamente. En algunas marcas como Toshiba, este ajuste se integra en el mismo botón con el Zoom y no se deben de confundir, en otras marcas como Samsung, están separados como puedes ver en las fotos expuestas a continuación.

Well, this is easy to understand, but this type of distance is accompanied by the choice of ultrasound probes that give us the correct image for each study … when we talk about the types of transducers, we said that the linear ones were of high frequency and the low frequency convex. In the following link you can check this information. https://ecografiafacil.com/2018/01/01/11-tipos-de-transductores/ Therefore, for techniques that require shallow studies we will use high frequency probes and for deeper studies, we will use low frequency probes. This adjustment is usually located in the keypad to the right of the trackball and the freezer, can be identified in English as «Depth» and is usually placed next to the focus, another adjustment of great importance and we will study very soon. In some brands like Toshiba, this setting is integrated in the same button with the Zoom and should not be confused, in other brands such as Samsung, are separated as you can see in the photos shown below.

En las dos primera imágenes vemos ambas funciones y un solo botón, en la tercera un botón negro con una lupa con un + dentro y abajo la tecla «Depth», funciones separadas.


Debemos diferenciar profundidad y zoom. Profundidad es la distancia que necesitamos ver para llevar a cabo un estudio y el zoom se usa para captar una imagen en unas condiciones y mediante la aplicación de un software, realizar un aumento, «inventando» píxeles inexistentes a partir de otros que se han recogido. Es como hacer una foto, donde la distancia sería el tamaño de pantalla que necesitamos para meter dentro un atardecer en el mar y el zoom sería una imagen, ampliada a posteriori, sólo del sol…solo que en ecografía, el zoom puede usarse en tiempo real. Por tanto, siempre tendremos más calidad de imagen usando la profundidad y no el zoom, siendo este último de uso específico para ampliar alguna estructura en particular.

Si cambiamos la profundidad modificamos la velocidad de refresco de la pantalla, sabremos más de esto más adelante, no es lo mismo escanear 5 cms que 20 cms.

In the first two images we see both functions and a single button, in the third a black button with a magnifying glass with a + inside and below the «Depth» key, separate functions. We must differentiate depth and zoom. Depth is the distance we need to see to carry out a study and zoom is used to capture an image in some conditions and by applying software, make an increase, «inventing» nonexistent pixels from others that have been collected . It’s like taking a picture, where the distance would be the screen size we need to put a sunset in the sea and the zoom would be an image, enlarged a posteriori, only from the sun … only in ultrasound, the zoom can be used in real time. Therefore, we will always have more image quality using depth and not zoom, the latter being of specific use to extend some particular structure. If we change the depth we modify the refresh rate of the screen, we will know more about it later, it is not the same to scan 5 cm than 20 cm.


17. Freezer y Cine.

En este post vamos a tratar dos ajustes ecográficos muy usados, uno de ellos el que más, que es el Freezer o congelador de la imagen y que va acompañado del Cine que es un ajuste que sin ser tan usado, su utilidad es muy relevante, sobre todo en alguna técnica ecográfica donde el paciente no sea colaborador…empezamos…

El congelador o freezer es el botón más usado de la botonera de control del ecógrafo. Cada vez que queramos hacer una foto vamos a congelar la imagen para verla detenida en pantalla y ver si es correcta para almacenar.

In this post we are going to discuss two very used echographic adjustments, one of them the most, which is the Freezer or Freezer of the image and that is accompanied by the Cinema that is an adjustment that without being so used, its usefulness is very relevant, especially in some ultrasound technique where the patient is not a collaborator … we started … The freezer or freezer is the most used button of the control panel of the ecograph. Every time we want to take a picture we will freeze the image to see it stopped on screen and see if it is correct to store.
Marca 1.Botón azul grande por encima del trackball con icono de copo de nieve.
Marca 2.Botón grande anaranjado abajo a la derecha de la imagen.
Marca 3.Botón grande anaranjado abajo a la derecha de la imagen.


Suele tener un aspecto principal en la botonera, suele ser más grande y llamativo, estará centrado o ligeramente tirado a la derecha, cerca siempre del trackball. Como vemos en las tres imágenes anteriores de tres marcas diferentes.

Cuando congelamos la imagen no solo paramos la imagen en la pantalla, también hacemos que los cristales del transductor se queden en pausa y por tanto dejen de trabajar, cuestión muy importante para su conservación duradera, recomendamos encarecidamente que cuando el equipo no esté usándose, por ejemplo, entre paciente y paciente, que el freezer esté activado (imagen parada) para que los cristales no trabajen y la pantalla tampoco. Esta función del freezer es mayúscula.

Es el botón que más se usa, fácil de entender, porque cada imagen que queramos guardar activaremos esta función, aunque algunas veces esa imagen no sea válida y tengamos que volver a descongelar.

Cuando nuestro ojo ve en pantalla una imagen que quiere guardar y nuestro cerebro le da la orden a nuestro dedo para congelar la imagen, pasan décimas de segundo que el paciente, por ejemplo un bebé, puede aprovechar para moverse y hacer que la imagen que queríamos ya no aparezca en la pantalla…¿Por qué razón cuento esto? Esta cuestión viene a colación del segundo ajuste del día de hoy, el cine…

El cine es un ajuste que permite revisar una serie de imágenes que el ecógrafo ha ido guardando previamente antes de pulsar el congelador con objeto de poder «rebobinar» y volver hacia atrás para encontrar la imagen que mi ojo había visto, seleccionarla y poder hacer la foto deseada antes de que el bebé de nuestro ejemplo se hubiese movido…es un ajuste genial¡¡¡

En algunos ecógrafos este ajuste está integrado en la botonera, pero otras veces es un ajuste automático que se activa al pulsar el botón de freezer y es el trackball el que asume esta función.

¿Pero cuantas imágenes puedo guardar? Desgraciadamente solo podemos guardar unas cientos de imágenes, eso es a penas unos segundos antes de apretar el botón de freezer ya que la imagen ecográfica que vemos en la pantalla es la representación de una gran superposición de imágenes que se van refrescando automáticamente, pero esta cuestión la abordaremos más adelante.

Estas cientos de imágenes que puedo guardar son más que de sobra para lo que nos interesa ya que almacena varios segundos y por tanto varios decenas o cientos de imágenes.Eso sí, cuando volvamos a activar la imagen o a descongelarla, esas imágenes se perderán y volverán a almacenarse otras hasta que volvamos a pulsar de nuevo el congelador. Sólo se almacenan imágenes durante unos segundos previos a la activación del freezer, si pasan minutos entre uso y uso del freezer sólo se almacenan la imágenes que se han guardado unos segundos antes de pulsar el esta función.

It usually has a main aspect in the keypad, it is usually bigger and more striking, it will be centered or slightly pulled to the right, always close to the trackball. As we see in the three previous images of three different brands. When we freeze the image we not only stop the image on the screen, we also make the transducer glasses stand still and therefore stop working, a very important issue for its lasting conservation, we strongly recommend that when the equipment is not being used, example, between patient and patient, that the freezer is activated (stop image) so that the crystals do not work and the screen does not work either. This function of the freezer is capitalized. It is the button that is most used, easy to understand, because each image that we want to save will activate this function, although sometimes that image is not valid and we have to re-unfreeze it. When our eye sees an image on the screen that we want to save and our brain orders our finger to freeze the image, it takes tenths of a second for the patient, such as a baby, to take advantage of the movement to make the image we want no longer appears on the screen … Why do I tell this? This question comes to mind the second adjustment of today, the cinema … The cinema is a setting that allows reviewing a series of images that the ultrasound system has previously saved before pressing the freezer in order to «rewind» and go back to find the image that my eye had seen, select it and be able to do it. desired picture before the baby of our example had moved … it’s a great fit! In some echographs this adjustment is integrated in the keypad, but other times it is an automatic adjustment that is activated when the freezer button is pressed and it is the trackball that assumes this function. But how many images can I save? Unfortunately we can only save a few hundred images, that is hardly a few seconds before pressing the freezer button since the ultrasound image that we see on the screen is the representation of a large superposition of images that are refreshed automatically, but this question we will address it later.
These hundreds of images that I can save are more than enough for what interests us since it stores several seconds and therefore several tens or hundreds of images. That is, when we re-activate the image or defrost it, those images will be lost and will return to store others until we press the freezer again. Only images are stored for a few seconds before the freezer is activated, if minutes pass between the use and use of the freezer, only the images that have been stored for a few seconds are saved before pressing this function.

En la imagen vemos dos rectángulos amarillos. En el superior a la derecha es el del icono del cine que es la rueda que está justo debajo, integrado en la consola, justo superior al botón azul de congelar o inmovilizar la imagen. Repito, en esta marca, en otras, es una función asumida por el trackball.

Abajo y central, otro rectángulo que marca una serie de imágenes o frames (acostumbraros a esta terminología) y que marca un Fr254, que quiere decir que se ha escogido la imagen 254 de todas las que habían sido guardadas en la serie, que en este caso estaría en torno a 300 imágenes…

Ambas funciones son «operador-dependiente», es decir, es la persona que está realizando el estudio, el Técnico de Radiología, en nuestro caso, el encargado de manejar dichas funciones.

Nos vemos en el siguiente…

In the image we see two yellow rectangles. In the upper right is the icon of the cinema that is the wheel that is just below, integrated into the console, just above the blue button to freeze or immobilize the image. I repeat, in this brand, in others, it is a function assumed by the trackball. Bottom and center, another rectangle that marks a series of images or frames (accustomed to this terminology) and that marks a Fr254, which means that the image 254 of all those that had been saved in the series has been chosen, that in this case would be around 300 images … Both functions are «operator-dependent», that is, it is the person who is conducting the study, the Radiology Technician, in our case, the person in charge of handling said functions. See you in the next …

16. La Ganancia Parcial.

En el capítulo anterior hablábamos de que somos capaces de intervenir en la amplitud de los ecos para poner la imagen más brillante o menos brillante, de modo general, es decir, en toda la pantalla, pero además te cuento hoy que somos capaces de intervenir en esa amplitud de forma parcial, según la zona de la pantalla que me interese, con este ajuste ecográfico que se llama «Ganancia Parcial» o TGC (compensación tiempo ganancia).

La ganancia parcial es un ajuste ecográfico donde 8 potenciómetros se reparten el brillo de la pantalla en 8 zonas diferentes de superficial a profundo, de modo que soy capaz de potenciar los ecos de retorno producidos en las interfases más profundas (débiles por la atenuación producida por la distancia) para que se «vean» igual de bien, que los ecos de retorno mas superficiales, que son «más fuertes»… Me explico, los ecos de retorno profundo son más débiles que los más superficiales, lógico, porque la energía tiene que recorrer más espacio y se debilita, yo puedo «ecualizar», reforzar esos ecos de retorno profundos para que lleguen mejor al transductor.

Si estoy hablando con una persona a 2 metros la oiré mejor que si hablo con ella a 20 metros, en este caso, tendremos que hablar más alto a 20 metros que a 2, esto es lo que hago con la TGC, elevar el volumen de los ecos de retorno lejanos para oírlos mejor.

In the previous chapter we talked about how we are able to intervene in the amplitude of the echoes to make the image brighter or less bright, in a general way, that is, in the whole screen, but I also tell you today that we are able to intervene in that amplitude of partial form, according to the area of ​​the screen that interests me, with this ultrasound adjustment called «Partial Gain» or TGC (compensation time gain). The partial gain is an echographic adjustment where 8 potentiometers share the brightness of the screen in 8 different shallow to deep zones, so that I am able to boost the return echoes produced in the deeper interfaces (weak by the attenuation produced by distance) so that they «look» just as well, as the more superficial return echoes, which are «stronger» … I mean, the deep return echoes are weaker than the shallower ones, logical, because the Energy has to travel more space and weakens, I can «equalize», reinforce those deep return echoes so they get better to the transducer. If I am talking to a person at 2 meters I will hear it better than if I talk to her at 20 meters, in this case, we will have to talk higher at 20 meters than at 2 meters, this is what I do with the TGC, raise the volume of the distant echoes of return to hear them better.
Potenciómetros TGC.

En la imagen anterior ves marcado con el número 3 una serie de botones escalados y en cifra de 8. El superior corresponderá a la parte más superficial de la imagen, la más cercana al transductor, y el inferior a la parte más alejada del transductor, la más profunda en la imagen. Los 8 se reparten así toda la pantalla, el 4 y el 5 potenciómetro, así conocidos cada botón, serán la parte central de la imagen.

Si movemos los potenciómetros a la izquierda oscurecemos la imagen, si lo hacemos a la derecha la haremos brillar más en la región de la imagen correspondiente al potenciómetro que movamos…Basta de literatura, ejemplos…

In the previous image you see marked with the number 3 a series of buttons scaled and in figure of 8. The superior will correspond to the most superficial part of the image, the closest to the transducer, and the inferior to the furthest part of the transducer, the deepest in the image. The 8 are distributed so the entire screen, 4 and 5 potentiometer, well known each button, will be the central part of the image. If we move the potentiometers to the left we darken the image, if we do it to the right we will make it shine more in the region of the image corresponding to the potentiometer that we move … Enough of literature, examples …

En estas imágenes anteriores observamos una imagen correctamente realizada en función de la alineación correcta de los potenciómetros de la TGC, que si observas, están ligeramente oblicuados a la derecha para que en la parte más profunda de la imagen los ecos de retorno sean reforzados…

In these previous images we see an image correctly made based on the correct alignment of the potentiometers of the TGC, which if observed, are slightly oblique to the right so that in the deepest part of the image the return echoes are reinforced

Si realizo mal la técnica y alineo mal los potenciómetros 4 y 5 y los llevo a la izquierda dejaré en negro y sin información, la parte central de la imagen, tal como reflejan estas dos últimas imágenes.

Bien, para resumir…La TGC es la ganancia selectiva a diferentes profundidades para minimizar los efectos de la atenuación sobre la imagen. El ajuste de las ganancias conllevará un cambio en la imagen.Es un ajuste dependiente del operador que maneje dicho equipo, en nuestro caso, del Técnico de Rayos, responsable por tanto de la consecución de una imagen perfecta y diagnóstica.

Este ajuste siempre ha estado en la botonera, pero los equipos más modernos lo tienen integrado en su aspecto digital, funcionando exactamente igual. En esta imagen que ves a continuación y señalado con una fecha en rojo, ves la TGC en la pantalla táctil del equipo, cada vez más habitual, y no en la botonera…muy típico también de los equipos de ecografía portátiles, eso sí siempre dependiendo de cada marca comercial.

If I make the wrong technique and I align the potentiometers 4 and 5 wrongly and I take them to the left, I will leave the central part of the image in black and without information, as these last two images reflect. Well, to summarize … The TGC is the selective gain at different depths to minimize the effects of attenuation on the image. The adjustment of the gains will entail a change in the image. It is a dependent adjustment of the operator that manages said equipment, in our case, of the Rays Technician, responsible therefore for the achievement of a perfect and diagnostic image. This adjustment has always been in the keypad, but the most modern equipment has it integrated in its digital aspect, working exactly the same. In this image that you see below and marked with a date in red, you see the TGC on the touch screen of the equipment, more and more usual, and not in the keypad … very typical also of portable ultrasound equipment, yes always depending on each commercial brand.
TGC digital.


15. La Ganancia General.

En el botón 2D encontramos otra función vital además de la representación de la imagen en 2 dimensiones, a la que accedemos presionando este botón.

Encontramos que normalmente este botón tiene la capacidad de girar como una rueda y así intervenimos en el brillo de la imagen de manera global en la pantalla. Esta otra función del botón 2D es la llamada «Ganancia General» o «Gain» y la podemos definir como la capacidad que tenemos de modificar la amplitud del eco (magnitud de onda ultrasónica), resultando una imagen más o menos brillante. Los cambios de la ganancia general afectan a toda la imagen por igual. Dependerá y tendrá que ser adaptada a las características de cada paciente.

Es como si estás escuchando tu programa favorito de la televisión, pero no lo oyes bien y subes el volumen del aparato para poder escuchar correctamente…

In the 2D button we find another vital function besides the representation of the image in 2 dimensions, which we access by pressing this button. We find that normally this button has the ability to rotate like a wheel and so we intervene in the brightness of the image globally on the screen. This other function of the 2D button is called «General Gain» or «Gain» and we can define it as the ability we have to modify the amplitude of the echo (ultrasonic wave magnitude), resulting in a more or less bright image. Changes in the general gain affect the entire image equally. It will depend and it will have to be adapted to the characteristics of each patient. It’s as if you’re listening to your favorite TV show, but you do not hear it well and you raise the volume of the device to be able to listen correctly …
Marca 1
Marca 2

En la marca 1 solo podemos controlar la ganancia general en el botón 2D, en la marca 2 podemos hacerlo en 2D y además en la rueda central que rodea el track ball y que está marcado con la palabra «gain».

La ganancia general interviene por tanto sobre los eco recibidos, es decir, sobre los ecos de retorno, y solo sobre ellos. En la imagen vamos a ver que lo que estamos haciendo al manejar la ganancia general, es intervenir sobre el brillo de la imagen de manera global, como hemos dicho antes, pero quiero que lo veas en imágenes…

In the 1 mark we can only control the general gain in the 2D button, in the 2 mark we can do it in 2D and also in the central wheel that surrounds the track ball and that is marked with the word «gain». The general gain therefore intervenes on the echoes received, that is, on the return echoes, and only on them. In the image we will see that what we are doing when managing the general gain, is to intervene on the brightness of the image in a global way, as we have said before, but I want you to see it in images …

En estas 3 imágenes que vemos, tenemos una imagen que se ve con muy poco brillo, la primera, otra con un brillo óptimo, la segunda y una tercera excesivamente brillante. Tanto la primera como la tercera tienen una ganancia general incorrecta y nosotros la podemos modificar hasta dejar un brillo correcto, como en la imagen segunda.

Por tanto, este ajuste ecográfico o parámetro técnico depende del operador y es modificable por el mismo. Es el operador el que puede intervenir con este comando sobre la imagen. Es importantísimo y además se usa asíduamente, siendo uno de los principales ajustes ecográficos que tenemos que conocer y manejar perfectamente.

Para resumir, la ganancia general interviene en el brillo general de la pantalla, es modificable por el operador y es la capacidad que tenemos de modificar la amplitud de eco, recordemos la magnitudes de la onda ecográfica que estudiamos en el episodio 5… Depende del paciente y del estudio y es función del Técnico, del operador, encontrar la ganancia más apropiada para conseguir la mejor imagen posible para su uso diagnóstico.

In these 3 images that we see, we have an image that is seen with very little brightness, the first, another with an optimal brightness, the second and an excessively bright third. Both the first and the third have an incorrect general gain and we can modify it to leave a correct brightness, as in the second image. Therefore, this ultrasonic adjustment or technical parameter depends on the operator and is modifiable by the operator. It is the operator who can intervene with this command on the image. It is very important and it is also used regularly, being one of the main echographic adjustments that we have to know and handle perfectly. To summarize, the general gain intervenes in the overall brightness of the screen, is modifiable by the operator and is the ability we have to modify the amplitude of echo, remember the magnitudes of the ultrasound wave we studied in episode 5 … It depends of the patient and the study and it is the function of the Technician, of the operator, to find the most appropriate gain to obtain the best possible image for its diagnostic use.

12. La imagen. Modos de representarla.

En ecografía, la imagen que observamos es diferente a la de las diferentes técnicas que se usan habitualmente en un departamento de Radiología…es «menos anatómica» si me permitís esta expresión. La imagen producida en ecografía clínica es una imagen bidimensional y en escala de grises gracias al Scan converter, pero puede ser representada de otros modos, según el uso que le demos.

Bien, tenemos varios modos de imagen en un ecógrafo, cada una con un uso específico. Vamos a pasar a repasarlas:

1.Modo A o modulación de amplitud. Con el modo A mediremos las crestas o picos de intensidad generados por las interfases. El modo A nos ofrece información de la distancia a la que se encuentran los objetos con los que se topa el haz de ultrasonido, por tanto cada pico corresponderá a cada interfase del objeto u objetos. Se trata de una sola línea de escaneado. En el ejemplo del dibujo, cada estructura de color sería una interfase y por tanto se representaría en el eje de amplitud (vertical) y profundidad (Horizontal) como un pico.

In ultrasound, the image that is observed is different to the different techniques that are commonly used in a radiology department … it is «less anatomical» if you allow me this expression. The image produced in clinical ultrasound is a two-dimensional image and scale of thanks to Scan Converter, but can be represented in other ways, according to the use that the demonstrations. Well, we have several image modes in an ultrasound machine, each with a specific use. Let’s move on to review them: 1. Mode A or amplitude modulation. With mode A measure the crests or intensity peaks generated by the interfaces. Mode A gives us information about the distance to which objects are located with those in the ultrasound beam, therefore each peak corresponding to each interface of the object or objects. It is a single scan line. In the example of the drawing, each color structure would be an interface and therefore it would be represented on the amplitude axis (vertical) and the depth (horizontal) as a peak.
Representación Modo A.

2.Modo B o modulación de brillo transformará los picos del modo A en puntos luminosos. Al principio no había escala de grises. Solo puntos blancos y negros, al llegar el Scan Converter se llegaron a tener los 256 grises de hoy.

– Más tarde llega el Modo B en tiempo real y que gracias a la tecnología implementada en los transductores conseguimos introducir la variable tiempo.

Los transductores emiten varios haces ultrasónicos simultáneamente, ya que disponen de hileras de cristales, por tanto la imagen será la suma de la información recogido por cada elemento. Alrededor de 28 imágenes por segundo.

Este modo es el más usado en medicina.

2. Mode B or brightness modulation will transform the peaks of mode A into light points. At first there was no grayscale. Only black and white points, when the Scan Converter arrived, the 256 grays of today were reached. – Later on, Mode B arrives in real time and thanks to the technology implemented in the transducers we manage to introduce the time variable. The transducers emit several ultrasonic beams simultaneously, since they have rows of crystals, so the image will be the sum of the information collected by each element. Around 28 images per second. This mode is the most used in medicine.
Representación imagen Modo B.

3.Modo M o de movimiento, se usa una representación gráfica de la señal a lo largo de la línea que representa el haz ultrasónico. Se observarán los ecos como puntos de brillo de distinta intensidad, siendo la distancia también proporcional al tiempo que tardan en ser recibidos. Esta línea de puntos es presentada en el monitor de forma continua a lo largo del tiempo. 

Pueden seguir con precisión los movimientos de una estructura a lo largo del tiempo. Ecocardiografía.

3.Mode of motion, a graphic representation of the signal is used along the line representing the ultrasonic beam. Echoes will be observed as points of brightness of different intensity, the distance also being proportional to the time it takes to be received. This dotted line is displayed on the monitor continuously over time. They can accurately track the movements of a structure over time. Echocardiography
Representación imagen Modo M.


4.Doppler: Utiliza los cambios en la frecuencia del sonido producidos por la sangre en movimiento (permite el estudio del movimiento de las interfases hísticas).

El efecto Doppler se produce cuando un emisor o un reflector del sonido está en relativo movimiento con respecto al receptor.

El doppler nerece sin duda un episodio en este Blog y por tanto os invito a que esperéis el momento de que lo estudiemos.

4. Doppler: Uses the changes in the frequency of sound produced by the blood in movement (allows the study of the movement of the tissue interfaces). The Doppler effect occurs when an emitter or a sound reflector is in relative motion with respect to the receiver. Doppler certainly has an episode in this blog and therefore I invite you to wait for the moment we study it.
Representación imagen Modo Doppler.

11. Tipos de transductores.

Es posible discriminar los diferentes tipos de sondas ecográficas de manera sencilla según la forma en la que forman la imagen. Los transductores también suelen tener un aspecto físico bastante definido…

It is possible to discriminate the different types of ultrasound probes in a simple way according to the form in which they form the image. The transducers also tend to have a fairly defined physical appearance …

En la imagen observamos 3 tipos diferentes de sondas, dos lineales y otra cónvex.

1. Cónvex: Tienen una forma ligeramente curva. Trabajan a bajas frecuencias y tienen profundidades de hasta 30 cms.  La ecografía de Abdomen y Obstetricia es con mucho su uso principal.

Pertenecen a este grupo los microcónvex, con superficie reducida y frecuencias ligeramente más altas, hasta 9 MHz que consiguen penetrar hasta 15 cms. Son utilizados habitualente en pediatría.

Los endocavitarios también forman parte de este grupo, eso si con un diseño específico y adaptado al tipo de estudios que van a realizar. Mayoritariamente estudios ginecológicos. Antaño también transrectales para el estudio de la próstata, hoy es una técnica en deshuso.

2. Lineales: Línea de elementos recta. Pueden ampliar el campo visual gracias a su imagen trapezoidal. Frecuencias altas hasta 18 MHz.

Partes blandas, músculo, estudios vasculares, ecografía ocular…tienen gran versatilidad.

In the image we see 3 different types of probes, two linear and another convex. 1. Convex: They have a slightly curved shape. They work at low frequencies and have depths of up to 30 cms. Abdomen and Obstetrics ultrasound is by far its main use. The microconvex belongs to this group, with a reduced surface area and slightly higher frequencies, up to 9 MHz that can penetrate up to 15 cm. They are commonly used in pediatrics. The endocavitarios are also part of this group, that if with a specific design and adapted to the type of studies they will perform. Majority gynecological studies. Formerly also transrectal for the study of the prostate, today is a technique in disuse. 2. Linear: Line of elements straight. They can expand the visual field thanks to their trapezoidal image. High frequencies up to 18 MHz. Soft parts, muscle, vascular studies, ocular ultrasound … have great versatility.
                            Diferentes tipos de sondas

3. Sectoriales:

Utilizan tecnología phased array. Tienen forma cuadrada y campo visual estrecho proximalmente y muy ancho distalmente. Cardiología es su uso común.

3. Sectorial: They use phased array technology. They have a square shape and narrow visual field proximally and very wide distally. Cardiology is its common use.
Sonda cónvex                       Sonda lineal              Sonda sectorial


Sonda Cónvex.
Típica imagen conseguida con sonda cónvex de baja frecuencia, donde podemos observar la concavidad superior de la imagen que coincide con la piel del paciente.


Sonda Lineal.
Imagen de una sonda lineal de alta frecuencia, en la parte superior de la imagen y coincidiendo con la piel, vamos a tener una imagen recta.


Sondas o transductores especiales:

3D-4D, que llevan un motor aunque funcionan como transductores normales también.

Podemos variar el ángulo de exploración u hacer un barrido (3D) o hacer barridos continuados generando varios volúmenes por segundo dando lugar a la imagen 4D muy usada en el estudio de la ecografía prenatal.

Otros:

Biplanos. Dos filas de elementos, lineales y microcónvex, situadas perpendicularemente.

Lápiz Ciego. No genera imagen, solo captura señal doppler. Muy usados por los cirujanos vasculares para localización de vasos.

Existen otrás sondas, pero no son de uso cotidiano en las consultas de ecografía general y son estos:

Transesofágicos, Intracardiacos, Intraoperatorios.

Siempre escogemos la sonda adecuándonos a las características del paciente y del estudio a realizar. Para un abdomen adulto usaremos una sonda cónvex, pero para un paciente neonato que queramos estudiar el abdomen usaremos una lineal, para el adulto necesitamos unos 20 cms de profundidad para estudiar la cavidad abdominal, y para el bebé apenas 7 cms.

Aquí tenemos una nutrida representación de sondas usadas en las diferentes especialidades médicas cortesía de Canon.

Probes or special transducers: 3D-4D, which carry a motor although they function as normal transducers too. We can vary the angle of exploration or make a sweep (3D) or make continuous sweeps generating several volumes per second giving rise to the 4D image widely used in the study of prenatal ultrasound. Others: Biplanes. Two rows of elements, linear and microconvex, located perpendicularly. Blind pencil. Does not generate image, only capture Doppler signal. Very used by vascular surgeons to locate vessels. There are other probes, but they are not for everyday use in general ultrasound consultations and these are: Transesophageal, Intracardiac, Intraoperative. We always choose the probe adapting to the characteristics of the patient and the study to be performed. For an adult abdomen we will use a convex probe, but for a newborn patient we want to study the abdomen we will use a linear one, for the adult we need about 20 cm of depth to study the abdominal cavity, and for the baby, only 7 cm. Here we have a large representation of probes used in different medical specialties courtesy of Canon.
Diferentes tipos de sondas cortesía de Toshiba (ahora Canon).


10. El Transductor, su componentes.

Toca hablar de cosas «materiales», el transductor o sonda ecográfica lo es, porque es el artilugio con el que vamos a efectuar los estudios y que va a estar en contacto con el paciente, sobre su piel o más íntimamente como puede ser en los transductores endocorporales. Cuando cogemos una sonda, apenas reconocemos la carcasa y el cable que lo une al conector del ecógrafo, partimos pues entonces desde el conector…

La literatura sobre las entrañas de una sonda no es prolija, y debo hacer referencia al libro donde mejor he encontrado este apartado descrito. La obra es «Manual de técnica ecográfica de las física a la práctica» cuyos autores son Francisco Javier Ordóñez Gil y María Rosa Gómez Carbonell y está editado por Elsevier.

Bien, pasemos a describir los componentes internos de la sonda:

  1. Conector: Es el encargado de transmitir la señal eléctrica a los cristales, pero sin entrar en más detalles, la tecnología ha creado ya, sondas que funcionan vía Wifi no necesitando el cable que una el conector con la sonda…
  2. Cable: Referido con anterioridad, es el encargado de conducir la energía entre sonda y conector. Debe de llevar 2 cables por cada cristal que contenga la sonda ecográfica.
  3. El Material de amortiguación controla la vibración del material piezoeléctrico y mejora resolución axial.
  4. Circuito Flexible: Es el encargado de conectar el equipo y los cristales piezoléctricos.
  5. El Cristal Piezoeléctrico: Es conocido como cristal, pero en realidad es una cerámica con propiedades piezoeléctricas. Son los encargados de que convierte señal eléctrica en sonora y viceversa. El cuarzo es un cristal piezoeléctrico natural.
  6. Tierra: Se emplea en las instalaciones eléctricas para llevar a tierra cualquier derivación indeseada de la corriente eléctrica a aquello que pueda estar en contacto  con los usuarios (carcasas, aislamientos, etc.)  y que por un fallo del aislamiento de los conductores activos, pueda favorecer el paso de electricidad al usuario o al paciente.
  7. Capa de acoplamiento: La encargada de optimizar la transmisión de la mayor cantidad de ondas a través del tejido.
  8. Capa de apantallamiento:  Evita las señales de radiofrecuencia que puedan intervenir nocivamente en el circuito, señales de radio y vibraciones no deseadas.
  9. Lente: Zona del transductor que entra en contacto con el paciente y está realizada de un material especial.                                                                                                                                                                                                                      
It is important to talk about «material» things, the transducer or sonographic probe is, because it is the contraption with which we are going to carry out the studies and that will be in contact with the patient, on his skin or more intimately as it can be in the endocorporal transducers. When we take a probe, we hardly recognize the casing and the cable that connects it to the ecograph connector, then we start from the connector … The literature on the entrails of a probe is not neat, and I should refer to the book where I have found this section described. The work is «Manual of ultrasound technique of physics to practice» whose authors are Francisco Javier Ordóñez Gil and María Rosa Gómez Carbonell and is edited by Elsevier. Well, let’s go on to describe the internal components of the probe:
Connector: It is responsible for transmitting the electrical signal to the crystals, but without going into more details, the technology has already created, probes that work via Wifi, not needing the cable that connects the connector with the probe …
Cable: Referred previously, it is responsible for conducting the power between the probe and the connector. You must carry 2 wires for each crystal that contains the ultrasound probe. The damping material controls the vibration of the piezoelectric material and improves axial resolution.
Flexible Circuit: It is responsible for connecting the equipment and the piezoelectric crystals.
The Piezoelectric Crystal: It is known as crystal, but in reality it is a ceramic with piezoelectric properties. They are responsible for converting electrical signal into sound and vice versa. Quartz is a natural piezoelectric crystal.
Earth: It is used in electrical installations to ground any unwanted derivation of electric current to what may be in contact with users (housings, insulation, etc.) and that due to a failure of the insulation of active conductors, favor the passage of electricity to the user or the patient.
Coupling layer: Responsible for optimizing the transmission of the largest number of waves through the tissue.
Screening layer: Avoid radio frequency signals that may interfere harmfully in the circuit, radio signals and unwanted vibrations. Lens: Transducer area that comes into contact with the patient and is made of a special material.


9. El haz ultrasónico.

Ya sabemos como se produce un haz ultrasónico, es momento de saber cuales son su características.

El haz  se propaga, como comentamos al principio al frente y perpendicular a la cara anterior del transductor.

El haz tiene dos partes claramente diferenciadas:

Zona Fresnel o proximal. Cuando el haz sale del transductor (T, en el dibujo), podemos decir que energéticamente es heterogéneo, es decir, tiene interferencias debido a que no todas las ondas producidas en el transductor tienen exactamente la misma frecuencia o pueden tenerla, pero con distinta fase y pueden anularse en este caso. Si tienen la misma frecuencia, estas interacción entre las diferentes ondas puede ser constructiva y destructivas si estuvieran desfasadas y se anulasen, como ya hemos contado.

Zona Fraunhofer o distal. Debido al comportamiento normal del haz, en esta zona, el haz es divergente y coincide con el final de la zona fresnel. Esta es una región inútil del haz porque ya no podemos estudiar estructuras pequeñas.

Pero donde encontramos una zona donde sabemos que el haz es de mayor utilidad para la técnica es justo donde termina la Fresnel y empieza Fraunhofer y que se conoce como zona focal. Esta zona es «enfocable», es decir, como veremos más adelante, tenemos ajustes electrónicos dependientes del operador, para modificar o corregir la zona divergente del haz y poder aprovechar mejor el haz y hacer que mejore la calidad de la imagen, cuestión que veremos cuando hablemos de parámetros electrónicos.

We already know how an ultrasonic beam is produced, it’s time to know what its characteristics are. The beam propagates, as we discussed at the beginning in front and perpendicular to the front face of the transducer. The beam has two clearly differentiated parts: Fresnel or proximal zone. When the beam leaves the transducer (T, in the drawing), we can say that it is energetically heterogeneous, that is, it has interferences because not all the waves produced in the transducer have exactly the same frequency or can have it, but with a different phase and they can be canceled in this case. If they have the same frequency, these interactions between the different waves can be constructive and destructive if they were out of phase and canceled, as we have already said. Fraunhofer or distal zone. Due to the normal behavior of the beam, in this zone, the beam is divergent and coincides with the end of the fresnel zone. This is a useless region of the beam because we can no longer study small structures. But where we find an area where we know that the beam is most useful for the technique is just where the Fresnel ends and Fraunhofer begins and is known as a focal area. This area is «focusable», that is, as we will see later, we have electronic adjustments dependent on the operator, to modify or correct the divergent beam area and to take better advantage of the beam and improve the quality of the image, a matter that we will see when we talk about electronic parameters.
Zona Fresnel y Fraunhofer.