En ecografía, la imagen que observamos es diferente a la de las diferentes técnicas que se usan habitualmente en un departamento de Radiología…es «menos anatómica» si me permitís esta expresión. La imagen producida en ecografía clínica es una imagen bidimensional y en escala de grises gracias al Scan converter, pero puede ser representada de otros modos, según el uso que le demos.
Bien, tenemos varios modos de imagen en un ecógrafo, cada una con un uso específico. Vamos a pasar a repasarlas:
1.Modo A o modulación de amplitud. Con el modo A mediremos las crestas o picos de intensidad generados por las interfases. El modo A nos ofrece información de la distancia a la que se encuentran los objetos con los que se topa el haz de ultrasonido, por tanto cada pico corresponderá a cada interfase del objeto u objetos. Se trata de una sola línea de escaneado. En el ejemplo del dibujo, cada estructura de color sería una interfase y por tanto se representaría en el eje de amplitud (vertical) y profundidad (Horizontal) como un pico.
In ultrasound, the image that is observed is different to the different techniques that are commonly used in a radiology department … it is «less anatomical» if you allow me this expression. The image produced in clinical ultrasound is a two-dimensional image and scale of thanks to Scan Converter, but can be represented in other ways, according to the use that the demonstrations. Well, we have several image modes in an ultrasound machine, each with a specific use. Let’s move on to review them: 1. Mode A or amplitude modulation. With mode A measure the crests or intensity peaks generated by the interfaces. Mode A gives us information about the distance to which objects are located with those in the ultrasound beam, therefore each peak corresponding to each interface of the object or objects. It is a single scan line. In the example of the drawing, each color structure would be an interface and therefore it would be represented on the amplitude axis (vertical) and the depth (horizontal) as a peak.

2.Modo B o modulación de brillo transformará los picos del modo A en puntos luminosos. Al principio no había escala de grises. Solo puntos blancos y negros, al llegar el Scan Converter se llegaron a tener los 256 grises de hoy.
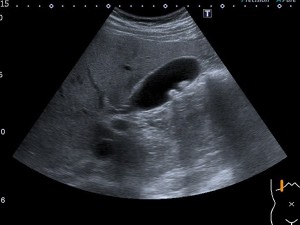
– Más tarde llega el Modo B en tiempo real y que gracias a la tecnología implementada en los transductores conseguimos introducir la variable tiempo.
Los transductores emiten varios haces ultrasónicos simultáneamente, ya que disponen de hileras de cristales, por tanto la imagen será la suma de la información recogido por cada elemento. Alrededor de 28 imágenes por segundo.
Este modo es el más usado en medicina.
2. Mode B or brightness modulation will transform the peaks of mode A into light points. At first there was no grayscale. Only black and white points, when the Scan Converter arrived, the 256 grays of today were reached. – Later on, Mode B arrives in real time and thanks to the technology implemented in the transducers we manage to introduce the time variable. The transducers emit several ultrasonic beams simultaneously, since they have rows of crystals, so the image will be the sum of the information collected by each element. Around 28 images per second. This mode is the most used in medicine.
3.Modo M o de movimiento, se usa una representación gráfica de la señal a lo largo de la línea que representa el haz ultrasónico. Se observarán los ecos como puntos de brillo de distinta intensidad, siendo la distancia también proporcional al tiempo que tardan en ser recibidos. Esta línea de puntos es presentada en el monitor de forma continua a lo largo del tiempo.
Pueden seguir con precisión los movimientos de una estructura a lo largo del tiempo. Ecocardiografía.
3.Mode of motion, a graphic representation of the signal is used along the line representing the ultrasonic beam. Echoes will be observed as points of brightness of different intensity, the distance also being proportional to the time it takes to be received. This dotted line is displayed on the monitor continuously over time. They can accurately track the movements of a structure over time. Echocardiography

4.Doppler: Utiliza los cambios en la frecuencia del sonido producidos por la sangre en movimiento (permite el estudio del movimiento de las interfases hísticas).
El efecto Doppler se produce cuando un emisor o un reflector del sonido está en relativo movimiento con respecto al receptor.
El doppler nerece sin duda un episodio en este Blog y por tanto os invito a que esperéis el momento de que lo estudiemos.
4. Doppler: Uses the changes in the frequency of sound produced by the blood in movement (allows the study of the movement of the tissue interfaces). The Doppler effect occurs when an emitter or a sound reflector is in relative motion with respect to the receiver. Doppler certainly has an episode in this blog and therefore I invite you to wait for the moment we study it.


Bravo. Es un tutorial muy completo y pedagogico sobre la «botonologia» de un ecografo.
Me gustaMe gusta
Bien todas las entradas
Me gustaMe gusta